
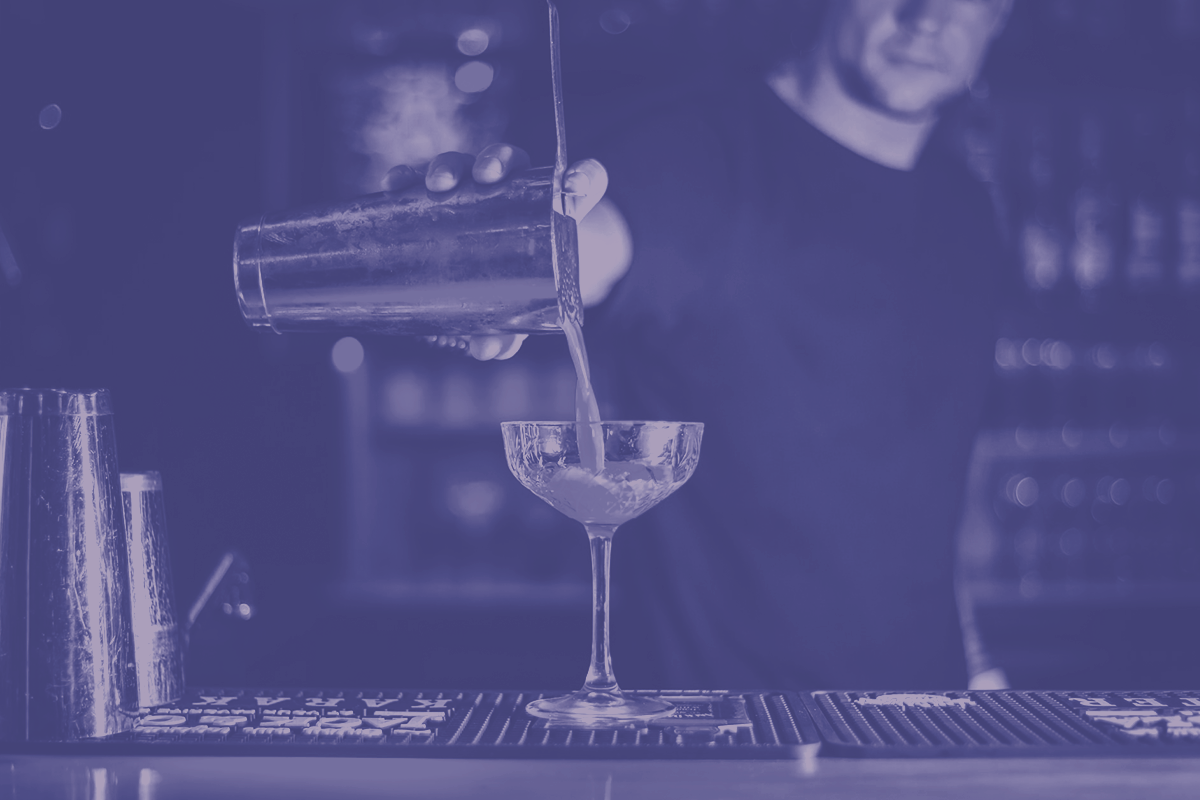
As staples of the service industry, both bars and restaurants are similarly run. However the way they track, value, and strategize sales and service can be a little different. Even full-service bars that exist inside restaurants sometimes track their own KPIs and run almost independently from the parent store.
In a previous article, we answered the question: how do you figure out food cost percentage? Many of the same practices and ways of thinking about pricing and inventory apply to those establishments which primarily offer alcohol service. But bar and beverage costing comes with its own set of rules, considerations, and equations that make it just different enough from food costing that we thought it deserved its own blog. Plus, we’re in the business of beverages, so we had to.
Beverage cost meaning
Your beverage cost, or “pour cost,” is the percentage of your bar’s overall revenue that is going towards keeping your inventory stocked. In other words, how much are you spending on your cocktail ingredients, and how is that measuring up to the amount of money you’re making from cocktail sales?
Beverage costing is also a useful tool for helping you to figure out what you should be charging for various bar menu items. That way when things get tight or a signature cocktail isn’t raking in the dough the way you thought it would, you can adjust both sales strategy and expenditure accordingly.
Beverage cost analysis
The simplest way to get your average pour cost is to divide the amount you spend on each drink by the amount for which that drink is sold. You can do this very generally for your entire inventory, but to have a more precise idea it’s better to take a categorical approach. Your beverage costs for wine, beer, and cocktails will all look pretty different from one another so you should think about figuring your pour cost for each, and even getting pour costs within those based on variety, pricepoint, etc.
On paper this seems relatively simple. But stuff happens in real bars, and we have to factor in what’s known as “variance” (loss, beverage inventory turnover, shrinkage) to gain a better understanding of our pour cost. In practical terms this means theft, breakage, spillage, and other accidents and eventualities of bar life that keep you from selling 100 percent of your inventory all the time. A case of missing ale or a shattered bottle of Schnapps will affect your profits for the month, and should be figured into costing.
Some industry analysts did the math and found out that average variance across all establishments surveyed hovers around 20 percent. This means that out of every 5 beers you buy, 1 will break, spill, or become the object of a drink-and-dash, bringing your profit margin a little lower, and your beverage cost a little higher.
The strategy many beverage establishments employ is to factor in variance when planning their menu prices. This can help you mitigate the effects of shrinkage and keep your pour cost at a steady level. So how do you calculate sell through percentage? We’ll talk more about how to do that in the next section.
Beverage cost percentage calculator
Written out as an equation, your beverage cost percentage formula looks like this:
Beverage Cost (BC) = Cost of Beverage/Beverage Sales Amount
Let’s say you buy your premium beer at around 3 dollars a bottle, and sell it for 12. Using the above beverage formula, you would write:
BC = 3/12
After doing the math, BC = 0.25, or 25 percent. This means your profit margin for your premium beer is 75 percent. Amazing. Go you.
Now let’s factor in variance. Let’s say your premium beer losses amount to a convenient 20 percent this month. That means your sellable product was 80 percent of your overall expenditure. So you would write:
BC = 3/(12 x 0.8) = 3/9.6 = 0.31
With variance factored in, your beverage cost for premium beer is closer to 31 percent.
Metric-driven beverage pricing can be determined by dividing the pour cost per beverage by your pour cost percentage. Maybe you got your 12 dollar price point by dividing your 3 dollar beer by a budgeted 25 percent beverage cost. With variance in mind, you can adjust your price point to match your desired beverage cost by using the following formula:
Selling Price = (Cost of Beverage x (1 + Variance Percentage))/Desired Beverage Cost
With our theoretical beer and variance in mind, that looks like this:
Selling Price = (3 x 1.2)/0.25 = 3.6/0.25 = 14.40
With variance in mind, your premium beer should be sold for 14.40 dollars per bottle in order to maintain a 25 percent pour cost.
Average beverage costs
Let’s talk about the average costing for common bar expenditures.
Bar consumables, 4 - 5 percent. These are things like napkins, limes, sugar, tajin, cocktail straws, decorative umbrellas, and other day-to-day items that go into the drinks at your bar. Their costing percentage is so low because most of these things are cheap to buy and factored in incrementally as a cocktail ingredient.
Bottled beer, 24 - 28 percent. Bottled beer cost percentage is a little on the higher side given the price of glass and the fact that they are purchased in cases, ready to sell upon delivery. The case of beer cost will almost always outweigh draft.
Draft beer, 15 - 18 percent. Beverages purchased at higher volumes will almost always come at a lower cost percentage to you. Draft beer that comes in a keg will usually have a lower beverage cost than its bottled cousin as you can sell it at a higher profit margin.
Liquor, 14 - 20 percent. Liquor has a wider margin due to the cost range between brands and styles of alcohol. But the average is generally pretty low as you can generate a lot of sales from just one bottle. And from one case of liquor, how many bottles will offset losses from other areas?
Wine, 22 - 45 percent. Wine gets tricky to calculate if you don’t standardize your pour. So do that first before you try to match your beverage cost to the average we have listed here. And, like liquor, different wine varieties and styles come at hugely different costs to both you and your customers.
A case of canned wine will come cheap to you and sell at the lower end of the scale. A case of rose wine imported from France is more expensive for you, but also deserving of a higher price tag on the menu. And a case of Sutter Home wine served with a generous pour may represent one of your best beverage costs if you sell it right.
How Provi can help
Provi is a digital beverage marketplace that helps connect buyers, distributors, sales reps and brands so they can make sales easily and focus better on serving their customers well.
Comments